Environmental EPA Air Quality · United States
Air quality intelligence for every covered ZIP.
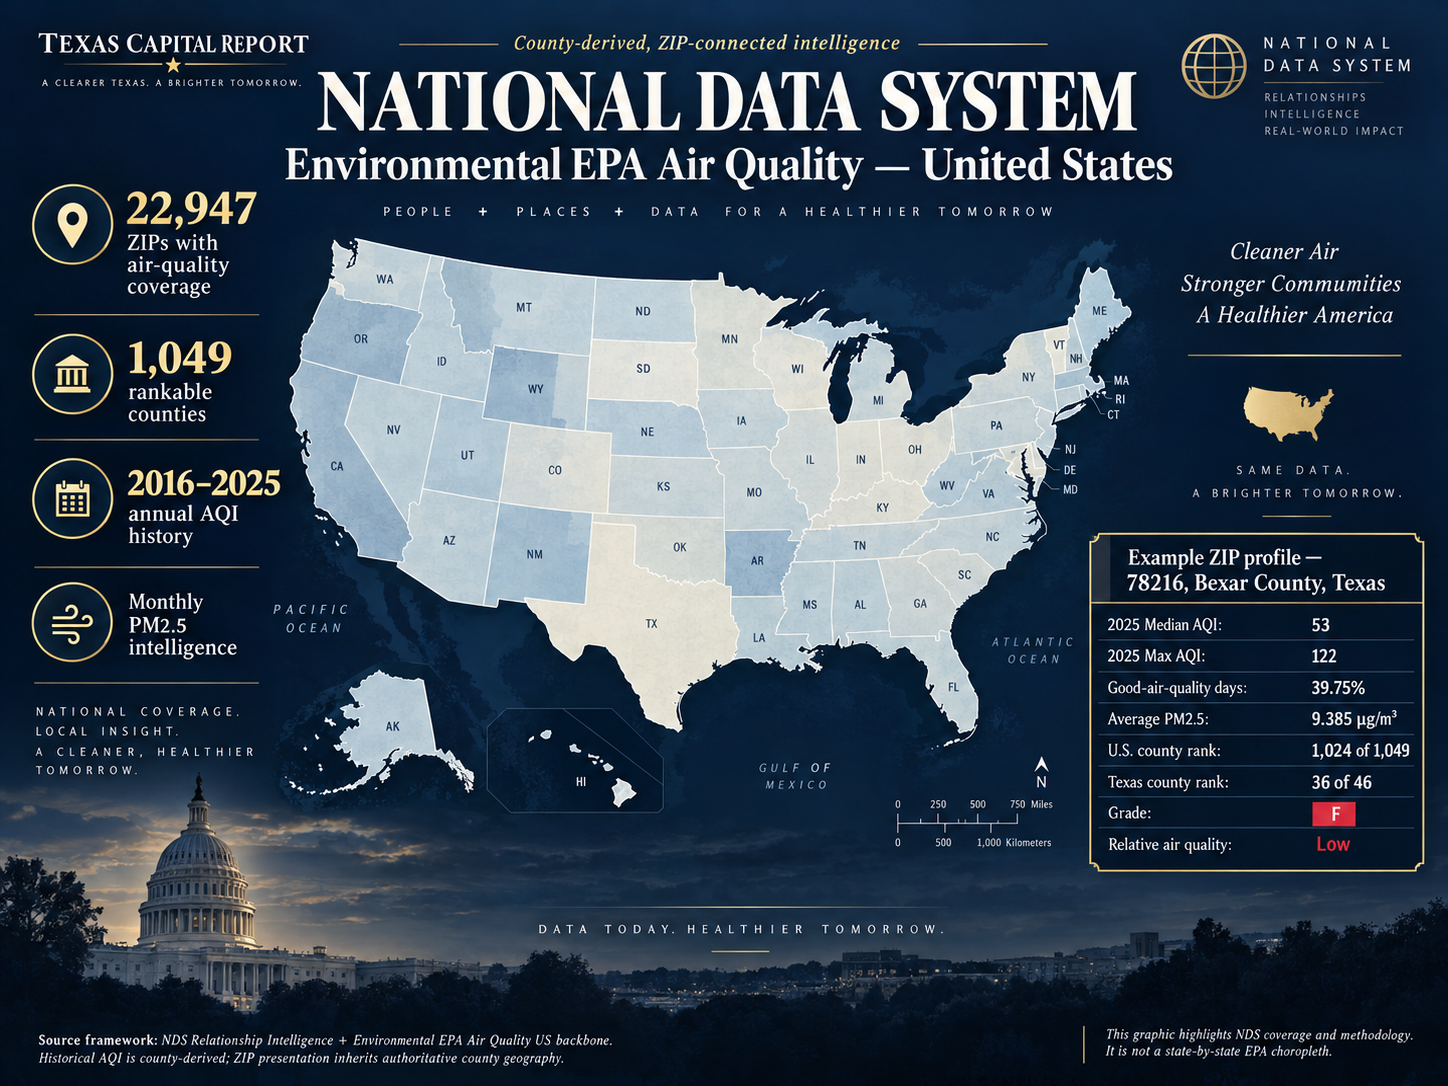
Explore county-derived EPA air-quality evidence, 2016–2025 history, relative county rankings and PM2.5 intelligence through the National Data System.
Explore the intelligence
National evidence. Local context.
The site keeps EPA evidence, NDS analytical rankings and historical change separate so readers can understand both the source data and the derived context.
ZIP Profiles
Median AQI, maximum AQI, good-air-quality days, PM2.5 averages and county-derived rankings.
County Rankings
Compare counties using the governed NDS relative air-quality score without fake within-county ZIP ranks.
Change Over Time
Review annual AQI history from 2016 through 2025 using the certified Relationship over-time layer.
Leading counties
Current relative air-quality ranking
Higher score means better relative air quality within the governed NDS county comparison universe. This is not an EPA regulatory ranking.
| U.S. Rank | County | State | Score | Median AQI | Good Days | Grade |
|---|
Methodology matters
County-derived evidence, ZIP-connected presentation.
Annual EPA AQI evidence is county-derived. The NDS Relationship backbone supplies the authoritative county-to-ZIP connection.